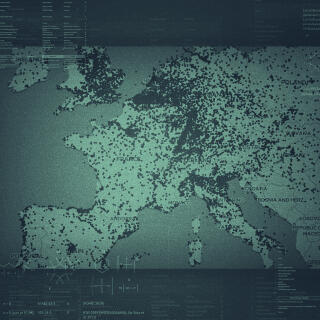
The Forever Pollution Map was created by Le Monde and its 17 partners from the cross-border investigation, the Forever Pollution Project. It is the first map to show the extent of Europe's contamination by per- and polyfluoroalkyl substances (PFAS), a family of ultra-toxic compounds used for a multitude of products and applications. Persistent in the environment, these "forever chemicals" will accompany humanity for hundreds of years – maybe even thousands.
- What the map shows
Our map shows PFAS production facilities, some sites where PFAS are used, as well as sites where contamination has been detected and those that are likely to be contaminated.
- 20 PFAS producers
These chemical plants synthesize PFAS, which are then used in many sectors.
- 23,000 sites where PFAS contamination has been detected:
Each of these sites has been sampled for PFAS in water, soil or living organisms by scientific teams and environmental agencies between 2003 and 2023. These measures have found PFAS at levels equal to or greater than 10 nanograms per liter (ng/L).
- 232 PFAS users
These industrial sites use PFAS to manufacture "high-performance" plastics, paints and varnishes, pesticides, waterproof textiles, other chemicals, etc.
- Over 21,500 presumptive contamination sites
These are sites with current or past industrial activity documented as both using and emitting PFAS. Military bases, for example, are major users of "AFFF" firefighting foams, which contain PFAS. The manufacturing of certain plastics called fluoropolymers also requires the use of PFAS.
While contamination of these sites is likely, no environmental sampling has been conducted to confirm this.
- Over 2,300 hotspots
The term "hotspot" is used when the concentration of PFAS detected at a site reaches a level that experts consider hazardous for health (100 ng/L). The problem is that dozens, sometimes hundreds of samples are taken by the authorities around a location identified as the "epicenter" of contamination – this is the case, for example, at the 3M plant in Zwijndrecht (Belgium) and the Chemours plant in Dordrecht (Netherlands) – but this does not make each of these points a hotspot in itself.
In order to reduce the number of these possible "false positives" as much as possible, we grouped geographically close points into "clusters". This calculation led us to estimate the number of hotspots at more than 2,100 throughout Europe.
- An unprecedented data collection
To build our map, we aggregated data from multiple sources of information, some of which were not public. These data allowed us to locate known contamination. To identify presumptive contamination sites, we adapted the methodology of a group of researchers who have done similar work to map contamination in the United States: the PFAS Project Lab (Boston) and the PFAS Sites and Community Resources Map. As our guides and advisors, seven experts accompanied us in this unprecedented experiment of peer-reviewed journalism to carry out this new kind of investigation.
The purpose of the “Map of Forever Pollution” is to provide data about sites known to be contaminated or likely to be contaminated with per- and polyfluoroalkyl substances (PFAS) in Europe.
Our primary goal is to inform the public and to provide data to impacted community members, researchers and regulators, and to contribute to building knowledge on PFAS contamination for the public interest. Potentially contaminated sites could therefore be prioritized by governments to conduct sampling campaigns and tailor action plans to protect the public.
This map reflects information gathered to the best of our knowledge and journalistic resources. Due to the lack of widespread environmental testing for PFAS, the true extent of contamination is significantly underrepresented.
The number of sites identified in each country or area reflects the amount of testing conducted by the authorities or scientists, as well as the extent of PFAS contamination.
Some known contamination sites, although identified with monitoring data, have no identified source of pollution. Some countries or areas appear to have many contamination sites due to comprehensive monitoring efforts to identify and address contamination. Conversely, countries or areas that have few known sources of contamination have likely done less testing and thus are unaware of other contamination sites in their area. Some sites may have incomplete or missing data due to a lack of publicly available information.
Consequently, some of the presumptive sites on the map are not contaminated with PFAS, and other sites that are contaminated are not included in the map.
If you reference information from the map, please credit the Forever Pollution Project and include the website address of this mapping project. Our map will not be systematically updated beyond March 1, 2023. If you would like to correct inaccurate, incorrect or outdated information or to provide additional data, please contact Stéphane Horel at horel[@]lemonde.fr.
Acknowledgements
Our research methodology was based on the peer-reviewed methodology developed by the PFAS Project Lab (Boston, USA) and colleagues for the “PFAS Sites and Community Resources Map” (a joint effort of the PFAS-REACH research team that includes Northeastern, Silent Spring Institute, Michigan State University, Testing for Pease, Massachusetts Breast Cancer Coalition, and Slingshot), as well as on advice and feedback from the following scientists: Alissa Cordner (Whitman College, Walla Walla, USA), Derrick Salvatore (Massachusetts Department of Environmental Protection, USA), Phil Brown and Kimberly K. Garrett (Northeastern University, Boston, USA), Ian Cousins (Stockholm University, Sweden), Gretta Goldenman (Global PFAS Science Panel, Brussels), Martin Scheringer (ETH Zürich, Switzerland).
It is important to note that we have systematically adopted the most conservative approach possible. In addition, there is a lack of data and a lack of comprehensive sampling in each of the European countries. Therefore, as impressive as it is, the number of contaminated and presumptive contamination sites shown on our map is greatly underestimated.
This map would not have been possible without the major contributions of our colleagues Sarah Pilz (Germany), Catharina Felke (NDR, Germany), Nadja Tausche (Süddeutsche Zeitung, Germany), Gianluca Liva (Radar Magazine, Italy), Leana Hosea and Rachel Salvidge (Watershed Investigations, UK).
Our full methodology can be found here.
- Open and reusable data
You can download the dataset we have put together to develop the map. The spreadsheet includes all geolocation coordinates and sources. For research purposes, however, we recommend that you use the detailed dataset, which includes sampling values for all PFAS as well as all our sources .
In January 2024, based on data from the Forever Pollution Project, the "Centre national de la recherche scientifique" (CNRS, France) launched the PFAS Data Hub project. On the website, you will be able to download an inventory that is regularly updated and supplemented with new sources of data.
⚠️ We have corrected errors since publication. Please make sure you download the most recent versions of the dataset and of the methodology.
Update on March 14, 2023: the download link has been updated.
Update on February 5, 2024: integration of new data about contaminated sites in Spain and Belgium.
Update on Octobre 23, 2024: addition of a reference to the PFAS Data Hub project.
- Revealed: The massive contamination of Europe by PFAS 'forever chemicals'
- Map: Explore the map of Europe's PFAS contamination
- Methodology: How Le Monde traced PFAS chemicals across Europe
- Consequences: What are the health effects of PFAS?
- Regulation: The key public health issue of defining an 'acceptable' threshold